From the Reports
section of the Team Home page
click on the Measure Reports link.
The Measure Charts
: Team Name
page is displayed. A list of all the measures that the team is currently
reporting on is displayed. To jump to the graph
and data results of a particular measure, click directly on the title
of a measure.
The graph and
associated data table is displayed.
To see the aggregate results for a measure, click the
Show aggregate data for project measure
check box and select a measure.
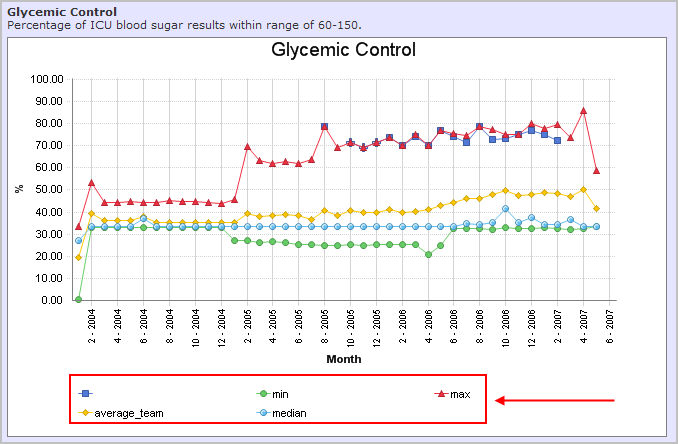
The aggregate results for a measure displays the minimum, maximum,
average_team and median
results for the data.
Selecting the Include
custom measures this team has created check box will display the
custom measures.
If there is more than one series of data for a measure
the graphs for each series would normally be shown separately, to combine
all series as one graph select the Multiple
series in one graph check box.
The data is mapped to a single graph with a data line
for each series.

To print a copy of the measure charts, click the View Printable Version button. The
charts are displayed in a new browser window, use the browser print command
to print the charts.
To download the data for the measures click the Download Data button. The data may be
opened (in a browser window) or saved and opened later in a spreadsheet
application.