From the Reports
section of the Team Home page
click on the view most recent
link.
The Progress
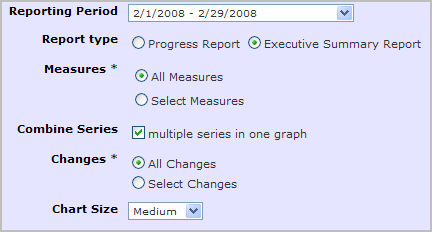
Report page is displayed. From the Report
Options select the correct Reporting
Period if the incorrect one is displayed.
Select the appropriate Report
type, the Executive Summary Report
offers fewer options, for example, no data tables will be displayed and
it will default to showing multiple series in one chart.
For the standard Progress Report click the check box for any of the Report Options available:
Change History - displays the history of each active change.
Aggregate measure Data - display the min, max, average and median for each project measure.
Custom Team Measures - include the custom measures that the team created in the list of charts.
Combine Series - display multiple series in a single graph.
Detailed Measure Data - displays a table of entered values for each measure.
Faculty Assessment - displays the faculty assessment if it has been entered.
Aim Details - displays the aim score.
Chart Size - display the charts as either Small, Medium, or Large.
Click the View
button.

The progress report for the selected period will be displayed. By default this will include the:
Aim
Reporting Period Summary
Change Status
Results
Self Assessment Score
Project Measures (Charts)
Project faculty
members will also be able to assess
and score each report. Click the
Assess and Score this Report button.

The Faculty Assessment
: Data Entry page is displayed in a pop-up window.
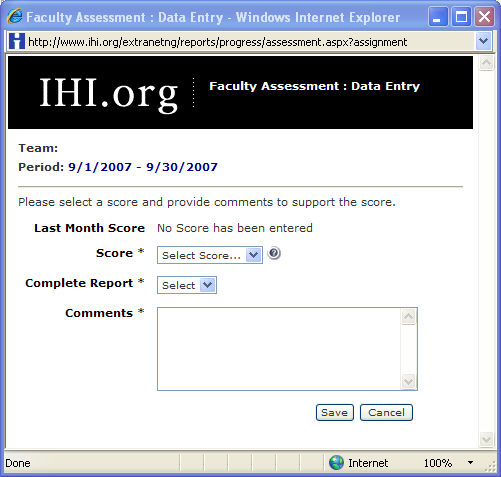
If a score had been entered for the previous month it
would be displayed by Last Month Score.
Click on the Score drop-down list
and select a score for this report. Clicking on the  icon will display the help
text for the scores.
icon will display the help
text for the scores.
Click on the Complete
Report drop-down list and select whether or not the report is complete.
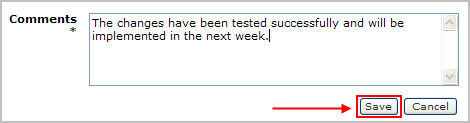
Complete the Comments
field and click the Save button.
The Faculty Assessment
is available for display.
To print a copy of the report, click the View
Printable Version button. The report is
displayed in a new browser window, use the browser print command to print
the report.
To download the data for the report click the Download Data button. The data may be
opened (in a browser window) or saved and opened later in another application.