From the Team Home
page Data Entry section click
on a measure.
The Select Series
page is displayed.
To add data to the series click on the +
Add Data button.

The Measure Data Entry
: measure
name page is displayed. The Chart
Preview screen is also displayed but no chart will be displayed
until data has been entered.
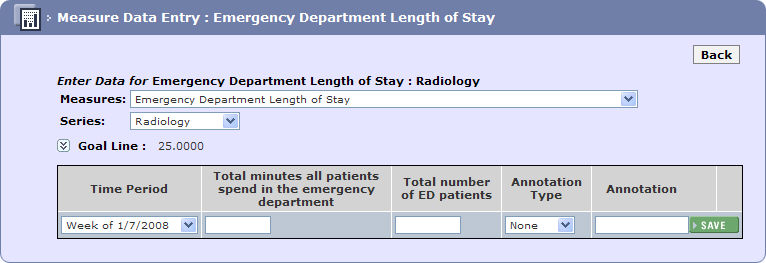
If a Goal Line
had not been set when the measure was created, there is an opportunity
for each team to set this on a measure by measure basis. Providing the
opportunity for each team to set their own individual goals.
If the Goal Line has been set,
teams may change it providing it does not compromise the goals of the
project.
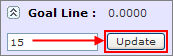
Click on the arrow to the left of Goal
Line.
Enter the numeric goal in the field displayed and click
the Update button, the goal for
the measure is set.
Select the Time Period
for the data to be entered.
Enter the Data
as required.
Select the Annotation
Type (if required):
None - default/standard data entry.
Event - an event that occurred that may have affected the data.
Change - a change that has been implemented, ensuing data points will chart whether the change has caused a permanent change.
If the Annotation Type is Event or Change then a brief annotation should be entered.
Click the 4SAVE button.

Repeat for all time periods.

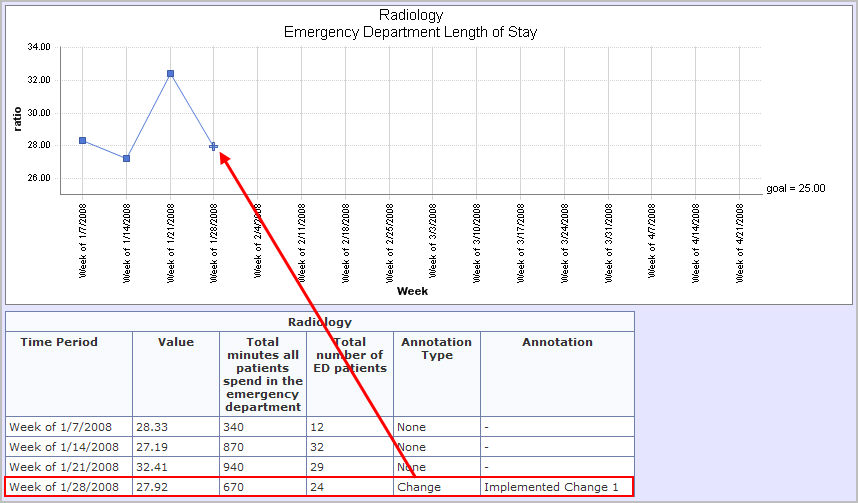
As the data is entered the Chart
Preview is updated, a table of values is also created. Changes
and Events are indicated by a
+ symbol on the chart.
Once all the entries have been made for a specific measure
you can then select another measure by clicking on the Measures
drop down and selecting the next measure.
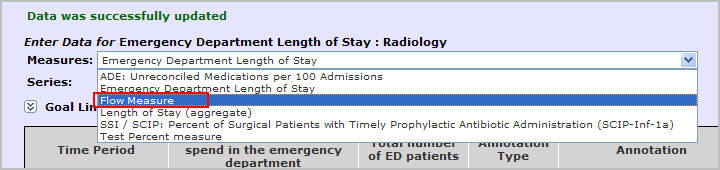
Continue to enter measure data as detailed in the previous steps.